Migrating a chart of accounts without breaking a single report
When finance re-cuts the general ledger, every dbt model, metric and dashboard downstream is exposed. A playbook: crosswalks, dual-running, zero-tolerance reconciliation, and treating the account hierarchy as a data contract.
On this page 9 sections
TL;DR
- A chart of accounts re-cut exposes every model, metric and dashboard that references an account number. Treat it as an architecture change, not a mapping exercise.
- Inventory every consumer of an account literal first, then model the crosswalk as a versioned, effective-dated table whose allocations sum to one and whose rationale column is mandatory.
- Dual-run one full close against the ERP's own conversion and reconcile at every hierarchy node with zero tolerance. A 37-cent rounding break is a specification bug.
- Make the hierarchy a contract: metrics reference hierarchy nodes, never raw account numbers, so the next migration is a pull request instead of a quarter.
- Translate history for analysis, but keep every published close frozen exactly as it was reported.
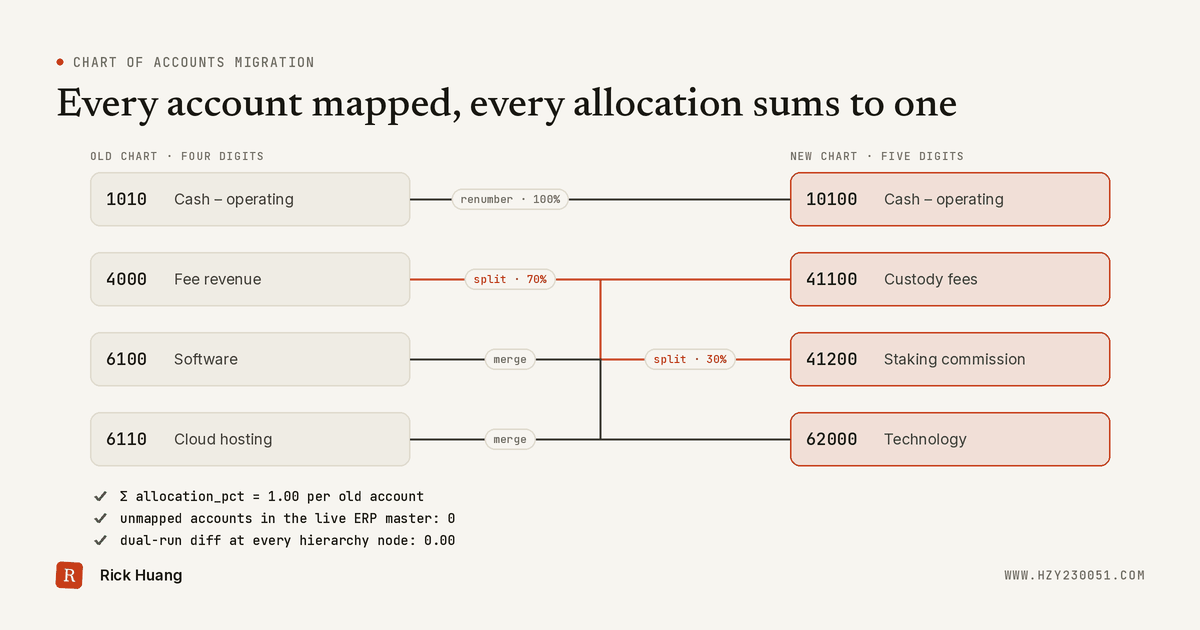
The spreadsheet arrives on a Thursday: a few hundred rows, an old account column, a new account column, and a column called “notes” that is mostly empty. It’s the new chart of accounts, effective at the start of next quarter, and from finance’s side the work is done. From the warehouse’s side, it hasn’t started.
The chart of accounts is the list of general-ledger accounts every transaction is booked to. It is the most important dimension in a finance warehouse, and it is owned by a team that doesn’t read your SQL. When it changes, the blast radius is every revenue, expense and balance metric, plus every account_number between 4000 and 4999 someone wrote years ago. Treat the migration as a mapping exercise and you’ll find those references one broken board deck at a time. Treat it as an architecture change and nothing moves by a cent it shouldn’t.
Here’s the playbook I use, with a toy company and a toy chart of accounts throughout.
The toy migration
The company is moving from four-digit to five-digit accounts and cleaning up along the way. Three kinds of mapping show up in every real migration, and this one has all three.
| Old account | New account | Type | Rule |
|---|---|---|---|
| 1010 Cash – operating | 10100 Cash – operating | one-to-one | renumber |
| 4000 Fee revenue | 41100 Custody fees, 41200 Staking commission | one-to-many | split by fee type |
| 6100 Software, 6110 Cloud hosting | 62000 Technology | many-to-one | merge |
One-to-one is trivial. Many-to-one is easy going forward and lossy going back. One-to-many is where migrations go wrong, because history booked to 4000 has to be divided between two new accounts, and somebody has to decide how.
Step 1: find the blast radius
Before touching the mapping, I inventory every consumer of an account number. Parse dbt’s manifest.json and scan each node’s raw SQL for account literals and ranges. A regex for account near =, in ( or between, followed by four- or five-digit numbers, catches most. Then walk lineage from the GL staging models to every exposure.
dbt only sees dbt, though. The worst references live in BI custom fields, spreadsheet exports and reverse-ETL syncs, so I pull SQL text from the BI tool’s API and grep the LookML and semantic-layer repositories too. Then I rank by consequence.
| Consumer | Reference found | Tier |
|---|---|---|
| Client fee statement export | account_number = '4000' |
external |
| Board revenue pack | account_number between 4000 and 4999 |
board |
| Opex by category dashboard | account_number in ('6100', '6110') |
operational |
External outputs get fixed and tested first. An operational dashboard can tolerate a day of noise; a client statement can’t.
Step 2: model the crosswalk
The finance spreadsheet becomes the crosswalk: a versioned, effective-dated table, with an owner, that maps every old account to its new ones.
create table map_gl_account (
  old_account     string  not null,
  new_account     string  not null,
  allocation_pct  numeric not null,  -- splits of one old account sum to 1.0
  effective_from  date    not null,
  effective_to    date,              -- NULL = open-ended; half-open interval
  recorded_from   timestamp not null, -- when this version of the row was entered
  recorded_to     timestamp,         -- NULL = current version
  rationale       string  not null   -- why, in finance's words
);

-- tests/assert_allocations_sum_to_one.sql : any row returned is a failure
select old_account, effective_from, sum(allocation_pct) as total_pct
from {{ ref('map_gl_account') }}
where recorded_to is null
group by old_account, effective_from
having sum(allocation_pct) != 1
Effective dating matters because the mapping itself can change. The custody-vs-staking split for an early fiscal year, before staking existed as a product, is 100/0. Later it isn’t. Effective dating alone doesn’t reproduce what was reported, though: if finance revises a split after a close, an effective-dated row silently rewrites that close. So rows are also versioned on when they were recorded, and published closes are frozen as snapshots (Step 5). That is the as-of vs. as-was distinction from an earlier post. I add one more test that no two rows for the same old account overlap in time, and I make rationale mandatory. Six months later, “why does 4000 split 70/30?” needs an answer that isn’t a person who has since changed teams.
A percentage split is the last resort, not the default. If the transactions behind the old account carry enough detail to classify them, use that instead. In a ledger-first warehouse, every fee line has an event_type, so custody fees and staking commission can be separated exactly for any period the sub-ledger covers. Allocation percentages are only for history that predates that detail.
Translating GL lines through the crosswalk looks like this. Note the rounding.
-- int_gl_line_translated: each old-CoA line becomes one or more new-CoA lines
with mapped as (
  select
    g.gl_line_id, g.posting_date, g.amount, m.new_account, m.allocation_pct,
    row_number() over (
      partition by g.gl_line_id order by m.allocation_pct desc, m.new_account
    ) as split_rank
  from {{ ref('stg_gl_line') }} as g
  left join {{ ref('map_gl_account') }} as m
    on  m.old_account = g.account_number
    and g.posting_date >= m.effective_from
    and (m.effective_to is null or g.posting_date < m.effective_to)
    and m.recorded_to is null  -- current version of the crosswalk
),
rounded as (
  select *, round(amount * allocation_pct, 2) as alloc_amount
  from mapped
)
select
  gl_line_id,
  posting_date,
  new_account,  -- NULL when unmapped: fails a not_null test instead of vanishing
  case
    when split_rank = 1  -- largest split absorbs the rounding remainder
      then amount - coalesce(sum(alloc_amount) over (partition by gl_line_id) - alloc_amount, 0)
    else alloc_amount
  end as amount
from rounded
Two details carry the weight. The left join means an unmapped account flows through with a NULL new_account and fails a test, rather than silently dropping out of an inner join. And the largest split takes the remainder, so the pieces of every line sum exactly to the original. Rounding both pieces independently is how a $0.05 line becomes $0.04 + $0.02.
Step 3: dual-run and reconcile every node
Dual-running means two independent computations of the same close, compared at every level of the hierarchy. For the last close under the old chart, finance runs the conversion in the ERP and produces a converted trial balance in new accounts. I produce the same thing in the warehouse from the crosswalk. Neither side gets to look at the other’s answer first.
The comparison runs on every node, not just the total, through a bridge table that lists each account’s ancestors, itself included:
-- any row returned is a break; tolerance is zero
with warehouse as (
  select a.node_id, sum(t.amount) as amount
  from {{ ref('int_gl_line_translated') }} as t
  join {{ ref('bridge_account_ancestor') }} as a on a.account_number = t.new_account
  where t.posting_date between date '2026-04-01' and date '2026-06-30'
  group by a.node_id
),
erp as (
  select a.node_id, sum(c.amount) as amount
  from {{ ref('stg_erp_converted_tb') }} as c
  join {{ ref('bridge_account_ancestor') }} as a on a.account_number = c.account_number
  where c.period_id = '2026-Q2'
  group by a.node_id
)
select
  node_id,
  w.amount as warehouse_amount,
  e.amount as erp_amount,
  coalesce(w.amount, 0) - coalesce(e.amount, 0) as diff
from warehouse as w
full outer join erp as e using (node_id)
where coalesce(w.amount, 0) != coalesce(e.amount, 0)
This compares period activity, which is right for P&L nodes. Balance-sheet nodes get the same treatment on closing balances.
Here’s what the first run of the toy dual-run returned:
| Node | Warehouse | ERP converted | Diff |
|---|---|---|---|
| Total revenue | 1,000,000.00 | 1,000,000.00 | 0.00 |
| 41100 Custody fees | 700,000.37 | 700,000.00 | +0.37 |
| 41200 Staking commission | 299,999.63 | 300,000.00 | −0.37 |
| 62000 Technology | 200,000.00 | 212,500.00 | −12,500.00 |
| Total operating expenses | 200,000.00 | 212,500.00 | −12,500.00 |
Revenue ties at the top and breaks at the leaves. That’s exactly why the total alone isn’t enough. The 37 cents isn’t noise. The warehouse allocated per GL line and rounded each one; the ERP allocated the account’s period total once. Both are defensible, they give different answers, and the crosswalk never said which grain was intended. The tolerance is zero because a rounding difference is a specification bug. We fixed it by classifying through the sub-ledger for the period it covers and allocating at account × month grain, matching the ERP, for older history.
The $12,500 was an account, 6120 Data subscriptions, that finance created in May after the crosswalk was frozen. The ERP conversion mapped it; the warehouse crosswalk didn’t, so its lines carried a NULL account and fell out of every node. The not_null test caught the line; the node reconciliation showed what it cost.
I run at least one full close this way, and I don’t cut over until a close comes back with zero rows.
Step 4: turn the hierarchy into a contract
Most of these breaks share a root cause: the hierarchy lives in finance’s spreadsheets, and the warehouse learns about changes after the fact. So the hierarchy becomes a contract.
The hierarchy is a versioned seed or source with a named owner in finance and a change process that goes through review. CI then enforces three rules, the same deterministic gates I’d use when certifying a model for finance reporting. Every account in the ERP account master must have a mapping row and a path to the root. Every hierarchy node must roll up to exactly one parent per version. And no metric definition may reference a raw account number; metrics reference hierarchy nodes.
That last rule is what makes the next migration cheap. If “fee revenue” is defined as the node revenue.fees in the semantic layer, rather than as an account range in forty models, re-cutting the accounts underneath it is a change to one mapping table. It’s the same argument I made about governed metrics in the semantic layer: the definition lives in one place or it lives nowhere.
Step 5: translate history, keep what was published
Once the new chart is live, every historical question splits in two. Trend analysis wants history translated into the new accounts so quarters are comparable. Anything already published (board packs, client statements, filings) must stay exactly as reported.
So I do both. Translated history, built through the crosswalk, is the default for analysis. As-was snapshots of every published close stay frozen. Every finance dashboard says which one it shows, and for two quarters after cutover the board pack shows both, with a bridge.
What goes wrong in practice
Accounts created mid-migration. Finance doesn’t stop operating while you migrate. Freeze the crosswalk with a date, and make the “every account is mapped” test run against the live ERP account master daily, not against a copy.
Budgets and forecasts on the old chart. Actuals move to the new accounts and plan-vs-actual breaks overnight because the budget was loaded against 4000. The budget needs the same crosswalk, or a re-plan, before cutover.
Re-parenting without renumbering. A hierarchy change that moves an account to a different parent changes every subtotal without touching a single account number. If the hierarchy isn’t versioned, last quarter’s numbers silently regroup.
Sign and presentation changes. New charts often reclassify contra-revenue or flip how discounts are presented. A mapping can be complete and still wrong by sign.
Intercompany and elimination accounts. Map these wrong and every entity reconciles while the consolidation doesn’t. Reconcile the consolidated tree, not just each entity.
Mid-period cutover. Never. Cut over on a period boundary, or every report for that month has two definitions in it.
The runbook
This is the one-page version I keep pinned during a migration.
| Phase | Exit criterion | Owner |
|---|---|---|
| Inventory | Every consumer of an account literal listed and tiered | Data |
| Crosswalk | Every active account mapped, allocations sum to 1, rationale filled, finance sign-off | Finance + data |
| Tests | CI blocks unmapped accounts, orphan nodes and raw account numbers in metrics | Data |
| Dual-run | One full close with zero diffs at every node | Both |
| Sign-off | Controller signs the node-level reconciliation | Finance |
| Cutover | On a period boundary; metrics repointed to nodes; as-was snapshots frozen; dashboards labeled | Data |
| Decommission | Old models removed after one more clean close; literal scan returns zero hits | Data |
Cutover is the easy part
The day the new chart goes live should be boring. The hard work happens earlier: finding every place an account number hides, writing the crosswalk as data with an owner and a reason, and reconciling two independent answers to zero at every node until they agree.
Done that way, a chart of accounts migration leaves the warehouse better than it found it. Metrics point at concepts instead of numbers, the hierarchy has a contract, and the next re-cut is a pull request instead of a quarter.
Found this useful? Pass it on